|
Asia-Pacific Forum
on Science Learning and Teaching, Volume 12, Issue 2, Article 13 (Dec., 2011) |
The study used the pretest/posttest control group experimental design. In this model, the subjects are measured with respect to the dependent variable both before and after the experimental study. The subjects are divided into two groups, experimental and control groups,. The independent variable of this study was the interactive whiteboard use, the effects of which on learning were examined. The experimental group in this study was subjected to the combined use of an interactive whiteboard with educational software developed with Macromedia 8 flash program and the laboratory method. The control group, on the other hand, was allowed to experiment only with the laboratory method. The laboratory method administered to both groups included activities such as experiment, observation and control. Students in both groups learned about the subject and experiments in 8 hours. The dependent variable of the study, academic achievement, was measured in both groups of students with a pretest and posttest. In addition, in order to obtain the views of experimental group students after the experiment, the students were given a semi-structured interview form with four (3) questions as given in section 2.3
Table 2 presents the experimental groups and study design.
Table 2: Experimental Groups and Study Design
The study group consisted of 33 2nd year students from Kirikkale University, Department of Science Education, Faculty of Education. The experimental and control groups were set up according to the last digit of student registration number. The distribution of male and female students in the groups was homogeneous.
2.2. Academic Achievement Test
Two equivalent forms were prepared for pretest and posttest. Each of the tests contained 20 questions. The targets of the topic of electromagnetism were reviewed for preparation of questions to be included in tests. Questions were prepared taking into account the grade of the targets in Bloom’s taxonomy of cognitive domain. In addition, a literature review was performed. The topic/ target table was created in relation to the distribution of the questions in tests according to topics.
First, a form including interview questions prepared in accordance with objectives was created. The interview was administered to eight students on a voluntary basis and recorded.
The interview form contained the following questions;
What are. your opinions about the intelligibility of interactive board activities and their effects on students?
What do think are the advantages of interactive board applications in the instructional environment?
What is the greatest impact (feature) of interactive board applications that has impressed you and how would you describe this impact?2.4. Interactive Whiteboard Use
Interactive simulations are now extensively used in physics and chemistry education (Wieman, Adams, Loeblein and Perkins, 2009). In this study, the researchers prepared a model on the computer for electromagnetism education, which showed the electric motor, electric bell and generation of the induction current using Macromedia 8 flash and the students were asked to apply on the interactive whiteboard (smart whiteboard).
The targets of the topic, abstract concepts and laboratory experiments were taken into account while preparing the interactive simulations.
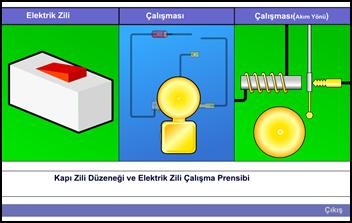
Figure 1. Educational software prepared by using Macromedia 8 flash program (the bell model)
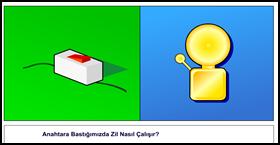
2.4.1. Electric Bell Button: is the aim here is that a doorbell model emerges in the mind of the student that clicks on the button displayed on the interactive whiteboard. When the student pushes the button, the bell prepared with the flash program rings.
.
2.4.2. Operation Button: The aim is that the student that clicks on the button on the interactive whiteboard sees the operation of the bell and the elements in its mechanism, and has some understanding about the action.
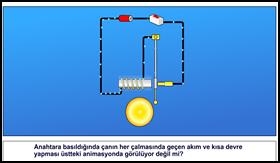
2.4.3. Operation (Direction of Current) Button:This is the most important button of the software. The student will see the direction of the current, which is usually stated in abstract terms and generally confuses students; s/he will understand the working principle of the bell; and s/he will be able to recognize the short circuit, which makes the bell ring, and comment on this event.
2.4.4. Exit Button: The student will use the button to quit the program when s/he realizes that s/he has understood the topic of bells.
In interactive smart whiteboard applications, a simple white board can be easily transformed into a touch screen smart whiteboard with the installation of a device. The lecturer has the opportunity to mark required parts and explain them in this environment. Any application that can be used on a computer can also be used on a smart whiteboard. The interactive whiteboard used in the study is one that allows students to use the educational software individually. Prior to the study, the experimental group the researchers explained the interactive whiteboard applications for 2 class hours, and each student practiced various simulations and thus learned how to use the interactive whiteboard .
The SPSS package program was used in the analysis of the data. In the present study, an interactive model was presented to an experimental group and a control group was applied. With this technique, the experimental and control group students’ pretest and posttest total achievement scores before and after the experiment can be compared, and the significance of the difference between experimental and control students’ achievement scores from the beginning to the end of the experiment can be assessed (Büyüköztürk, 2004). In data analysis, mean, standard deviation and t–tests were used. An independent groups t-test was used to test the difference between pretest and posttest means of experimental and control group.