 |
Asia-Pacific Forum on Science Learning and Teaching, Volume 9, Issue 1, Article
10 (Jun., 2008)
|
| |
Asia-Pacific Forum on Science Learning and Teaching, Volume 9, Issue 1, Article
10 (Jun., 2008)
|
MethodologyThe subjects of the study were sixth grade students in a primary school in Turkey. This study involved an experimental and a control group. The study was limited to concepts about the cell and other basic concepts related to cells. A biology achievement test and an attitude scale were used as data collection instruments. A quasi-experimental pre-test/post-test control group design (Campbell & Stanley, 1966) was used in this study. The 65 participants in this study were 6th grade students enrolled in a middle-class urban primary school in İzmir in Turkey. Nearly all the participants were 11-year-olds (except for two students). The primary school is equipped with computers and a science laboratory. There are 23 computers in the computer laboratory. The science laboratory is well-equipped. The experimental group consisted of 31 students and the control group consisted of 34 students. Two different teachers taught both groups until 6th grade. In 6 th grade, they were allotted to their classes according to their achievement levels in various subjects such as science, mathematics, Turkish language, etc. Since the Turkish Ministry of National Education does not allow changes in the classes after the school term has begun, two of the 6th classes were assigned randomly as experimental and control groups at the beginning of the study. The experimental group received instruction including interactive computer animation accompanied by teacher and student-prepared concept maps, while the control group received traditional instruction. This study was conducted over three weeks during which the cell and other related concepts were covered as part of the regular curriculum in the sixth grade general science course (each instruction took 40 minutes and continued for 3 hours a week over a period of 3 weeks, including data collection). The same teacher taught both the experimental and control groups in order to minimize the teacher differences. Before starting the instruction, the teacher was trained in how to instruct the program. The teacher was also trained to standardize the administration procedures and implementation of the instruction.
Prior to the 6th grade , in 4th grade the students in both groups learnt about living and non-living things in the environment. In 5th grade a plants and animals unit was taught. For example, students learnt about animal and plant nutrition. The mentioned units in the 4th and 5th grade are not taught in detail. To summarize, the students were not taught cell topics before 6th grade. Therefore, the students in both groups had similar backgrounds.
The students worked alone or in pairs as they used the interactive-animation of the computer. While using the animation, the students were given worksheets. They were asked to draw the cell and the organelles they saw and answer some questions. Primarily, students were taught about animal cells and related concepts through interactive animation, and then they were asked to make a concept map about animal cells. The experimental group was taught how to prepare a concept map. After the students in the experimental group had finished their concept maps, they compared them with those of the teacher and the researcher. The concept maps drawn by the teacher and the researcher were displayed on Datashow and the students were given the opportunity to control and evaluate their own maps and decide whether they had the right connections between the concepts. Briefly, the students learned the concepts through the computer, and then they were asked to form their own maps and compare them with those of the teacher and researcher. An example of a concept map prepared by a student is given in Appendix A.
Both the control and experimental groups saw an onion skin and blood cells with the naked eye through a microscope. However, the experimental group also had the opportunity to see the cells and all related constructions and organelles with the help of computer animation in detail, and to watch when they need. The teacher gave the same lecture and used the same assignments, and followed the daily course program in both groups. The difference between the groups was the method of instruction, namely, using the interactive computer animation accompanied by concept maps in one case, and not using them in the other. During the study, the researcher observed the control and experimental classes to ensure that the teacher followed the instruction procedures correctly.
The Cell Concept Achievement Test (Biology Achievement Test):
This test was developed by the researcher to identify the students’ understanding of cell concept and other related concepts. Originally, the test contained 30 multiple-choice items about knowledge, comprehension, and other levels of Bloom’s taxonomy. It was administered to a pilot study group of 193 students in seventh grade in three different primary schools. After an item analysis was carried out, a test of 18 items was constructed. The KR-20 reliability of the test was 0.67. The achievement test was administered to both groups before and after the instruction.
Two examples of the test items are:
1. Which of the followings is found in plant cells, but not in animal cells?
A) Cell walls and plastids C) Chromosomes and ribosome B) Mitochondria and plastids D) Cell membranes and endoplasmic reticulum
2.
Cell
Ribosome
Mitochondria
Chloroplast
X
+
+
+
Y
+
-
-
Z
+
+
-
In the Table above, the information pertains to organelles that X, Y, and Z cells contain is shown.
Considering this, which of the following information related to cells is certainly wrong?
A) X cell synthesizes its own food through light energy C) Z cell is the leaf cell of a plant B) Y cell uses oxygen for producing energy D) X, Y, and Z cells can synthesize protein.
Attitude Scale toward Science as a School Subject:
The scale was developed by Geban, Ertepınar, Yılmaz, Altın, & Sahbaz (1994) to identify primary students’ attitudes toward science as a school subject. The Attitude scale contains 15 items in a five-point Likert-type scale. The alpha reliability coefficient is 0.83. It was administered as pre- and post-tests to both groups. The students in both groups required approximately 35 minutes to complete both instruments (the achievement test and attitude scale) for the pre-tests and 45 minutes for the post-tests.
Designing and developing interactive computer animations for biology topics
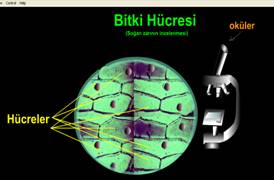
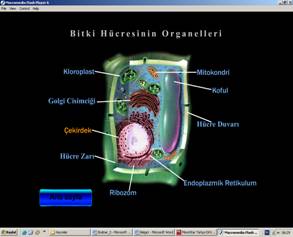
Macromedia Flash MX (Gumustepe, 2003) was used for authoring computer animation regarding animal and plant cells, the structure and function of the cell, cellular organelles, etc. Figure 1 shows some samples taken from the interactive computer animations. The researcher prepared the interactive computer animation with some support from computer experts.
A

B
C*
D

* Plant cell picture is cited in http://sun.menloschool.org/~cweaver/cells/plantcell
Figure 1. Some views taken from computer screen (in Turkish)
Figure 1 shows a display screen for the plant cell and its organelles taken from the computer animation according to the design guidelines. When the students click the button named oküler in Turkish (ocular in English) on the screen (A), he or she can see the basic structure of plant cells (B) and then, when they click another button (objectives), they can see an enlarged plant cell and its basic structures, but this view is not shown above. C is a view of an onion cell (plant cell) and D is a view of a nucleus of a plant cell. While searching the nucleus on the screen, the students can understand the functions of pores on the nucleus and its structure.


Copyright (C) 2008 HKIEd APFSLT. Volume 9, Issue 1, Article 10 (Jun., 2008). All Rights Reserved.