|
Asia-Pacific Forum on Science Learning and Teaching, Volume 10, Issue 2, Article 1 (Dec., 2009) Naki ERDEMİR Determining students’ attitude towards physics through problem-solving strategy |
The problem solving strategies of students in both groups were checked prior to the experimental procedure to assess whether or not there was significant difference in the attitude of students towards physics before exposing them to teacher-directed and self-directed problem solving techniques. ANOVA was applied to check the significant difference between attitude of experimental and control groups.
Table 1. Mean and standard deviation of the pretest and post-test scores of the both groups
Treatments
Groups
N
Pre-test
Post-test
SD
SD
PST
Experimental Group
90
3.02
1.241
4.85
.768
SLT
90
3.12
1.180
3.72
.986
LM
Control Group
90
3.01
1.191
3.22
1.10
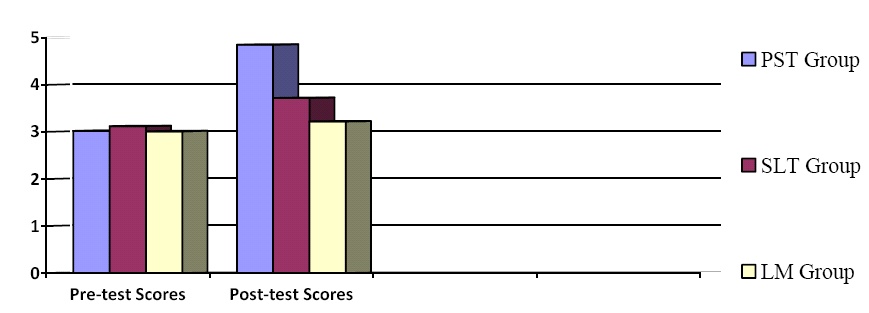
As can be shown in Table 1, prior to and after the planned topics, mean and standard deviations of both groups’ attitude scores were seen. Mean points could be considered to be equal prior to teaching. Mean and standard deviation scores of the experimental group were
= 3.02,
Mean and standard deviation scores of the experimental group were
Figure 1. Mean points of the pretest and posttest of the both groups in the graphical representation
Table 2. ANOVA of the scores in attitude scale of experimental and control groups before treatment
* Significant at level p< 0.05
Source of Variation
Sum of Square
df
Mean square
F
Sig.
Between Groups
.783
2
.634
1.965
.141*
Within groups
86.71
268
Total
87.49
270
As can be seen Table 2, the analysis of pre-test data is not a significant difference between groups’ scores, because students’ readiness attitude score levels towards physics courses are close to each other. In other words, at the end of analysis, no significant difference has been found between attitude scores of the experimental and control groups before treatment (F(2-268) =1.965, p=0.141).
Table 3. ANOVA of the scores in attitude scale of experimental and control groups after treatment
* Significant at level p< 0.05
Source of Variation
Sum of Square
df
Mean square
F
Sig.
Between Groups
4.16
2
3.353
14.46
0.000*
Within groups
62.32
268
Total
66.48
270
As seen in Table 3, students’ attitude scores toward the physics course varies depending on problem-solving strategies practiced in teaching. In other words, problem-solving strategies (independent value) have a positive impact on the students' attitudes scores (dependent value). The analyses shows that there is a significant difference between attitude scores of the experimental and control groups after treatment (F(2-268) =14.46, p=0.000).
Table 4. Scheffe’s Post Hoc ANOVA Test for the experimental and control groups in the attitude scores
* Significant at level p< 0.05
(I) Treatment
Mean
(J) Treatment
Mean
N
Mean Difference (I-J)
Sig.
PST
PST
SLT4.85
4.83
3.12SLT
LM
LM3.72
3.22
3.0190
90
901.43*
1.63*
0.110.003*
000*
0.52As suggested by Scheffe’s post hoc test, it was found that there was a significant difference between attitude scores of experimental and control groups after treatment. This significant difference was in favour of experimental group. It could be expressed that the problem solving method had a positive effect on students’ attitude towards their physics courses. It might also be concluded that the problem solving method has the effect on student’ success in the physics course and science education because of the relationship of attitude with respect to the achievement of students.